


Retirement Reality Check: 5 Charts from 2025 That Explain What’s Next
If you're wondering what really happened in the markets during 2025 and what it means for your retirement, you're not alone. Last year threw some curveballs that had many retirees questioning their investment strategy.
But here's the thing: when we look at the actual data, 2025 told a story that might surprise you, and it's one that reinforces some timeless principles about long-term investing.
The five charts that defined 2025 reveal crucial lessons about market volatility, the importance of staying invested, and why your retirement portfolio's success has little to do with politics and everything to do with patience.
These aren't just abstract concepts—they're real-world insights that could mean the difference between achieving your retirement goals and falling short.
Let me walk you through what happened last year and, more importantly, what it means for your money moving forward.
Key Takeaways
As we wrap up our look at the five charts that defined 2025, here's what every retiree should remember:
- Market volatility is normal, not exceptional. The 19% drawdown in 2025 was only slightly worse than the historical average. Expect volatility and plan for it rather than trying to avoid it.
- Staying invested beats market timing. The difference between holding through April's low and selling was dramatic—often 20-30 percentage points in returns. Time in the market beats timing the market.
- Politics don't predict portfolio performance. Seventy-five years of data show markets grow under both parties. Make investment decisions based on financial principles, not political predictions.
- Concentration in the Magnificent 7 warrants diversification, not panic. Be aware of concentration risk in the S&P 500, but address it through broader diversification rather than abandoning quality companies.
- Corporate earnings drive long-term returns. Strong earnings growth in 2025 provided the foundation for market recovery. Focus on fundamentals, not noise.
- Behavioral discipline matters more than investment selection. The investors who succeeded in 2025 weren't necessarily smarter or luckier—they were more disciplined about sticking to their plan.
- Retirement requires both stability and growth. Don't let fear of volatility push you into an overly conservative portfolio that can't sustain a 25-30 year retirement.
Understanding 2025's Market Rollercoaster
Picture this: You're checking your retirement account in April 2025, and your stomach drops. The market is down nearly 20% from where it started the year. Your neighbor mentions they sold everything and "went to cash" to avoid further losses. You're tempted to do the same.
This exact scenario played out for millions of retirees last year. And the decisions people made in that moment—whether to hold steady or panic sell—created vastly different outcomes by year's end.
Chart 1: Volatility Isn't the Exception—It's the Rule
Here's something that might shock you: market volatility in 2025 was actually normal. I know that sounds crazy when you're watching your account balance swing by tens of thousands of dollars, but the data tells a compelling story.
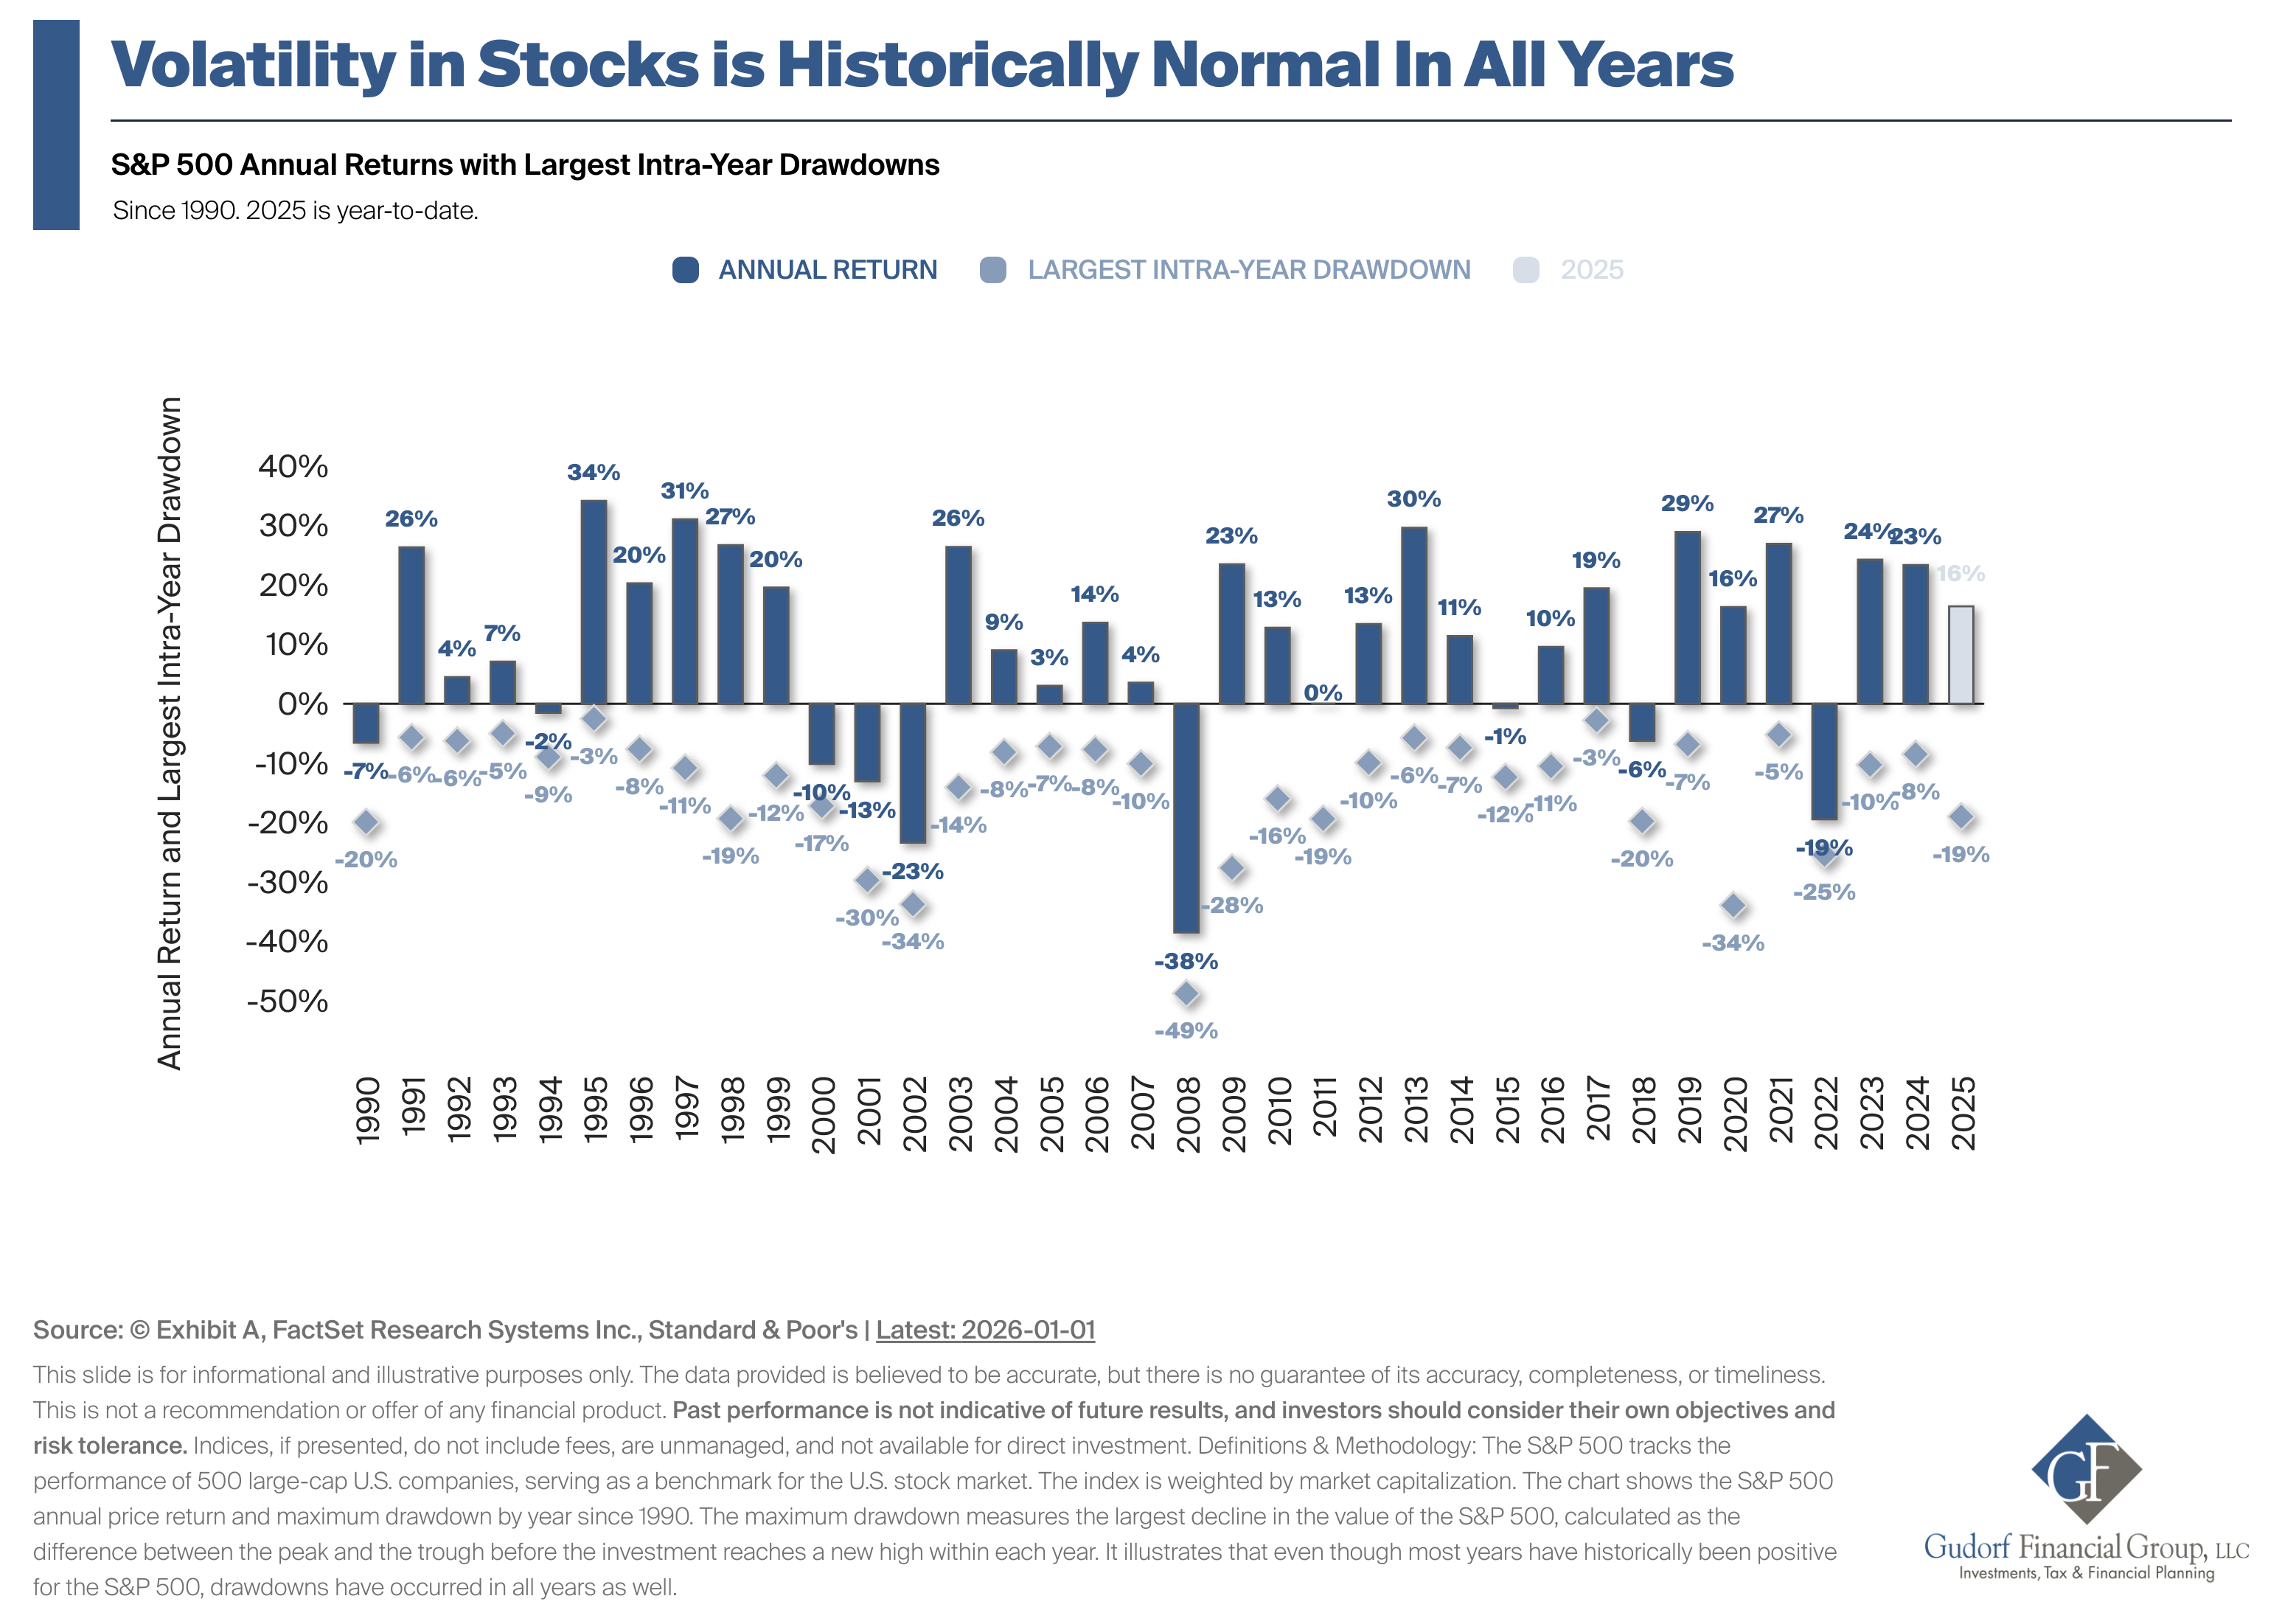
Since 1990, the S&P 500 has delivered an average annual return of 10.5%. Sounds great, right? But here's the catch—during that same period, investors faced an average intra-year drawdown of 14.1%. In plain English, that means even in years when the market ended up positive, it typically dropped about 14% at some point during the year.
In 2025, the market finished the year up 16%, which is solidly above that historical average. But to get there, investors had to stomach a 19% decline at the worst point. That's only slightly worse than the historical average drawdown.
What this means for you:
- Market dips during the year are completely normal, even when the year ends positively
- The temporary decline you see in April or May might reverse by December
- Emotional reactions to normal volatility can derail your retirement income strategy
Think of it this way: if you were driving from New York to Florida, you wouldn't turn around and go home just because you hit some traffic in Virginia. The temporary slowdown doesn't change your destination. The same principle applies to your retirement investments.
The Cost of Panic: Why Selling at the Bottom Hurt So Many
This is where 2025's story gets really interesting—and where we see the most important lesson for retirees.
Chart 2: The Difference Between Holders and Sellers
On April 8, 2025, the S&P 500 hit its lowest point of the year. That day, countless investors made a decision they would later regret: they sold. They couldn't take the uncertainty anymore. They wanted to "preserve what they had left."
But let's look at what actually happened to those who stayed invested compared to those who bailed out:
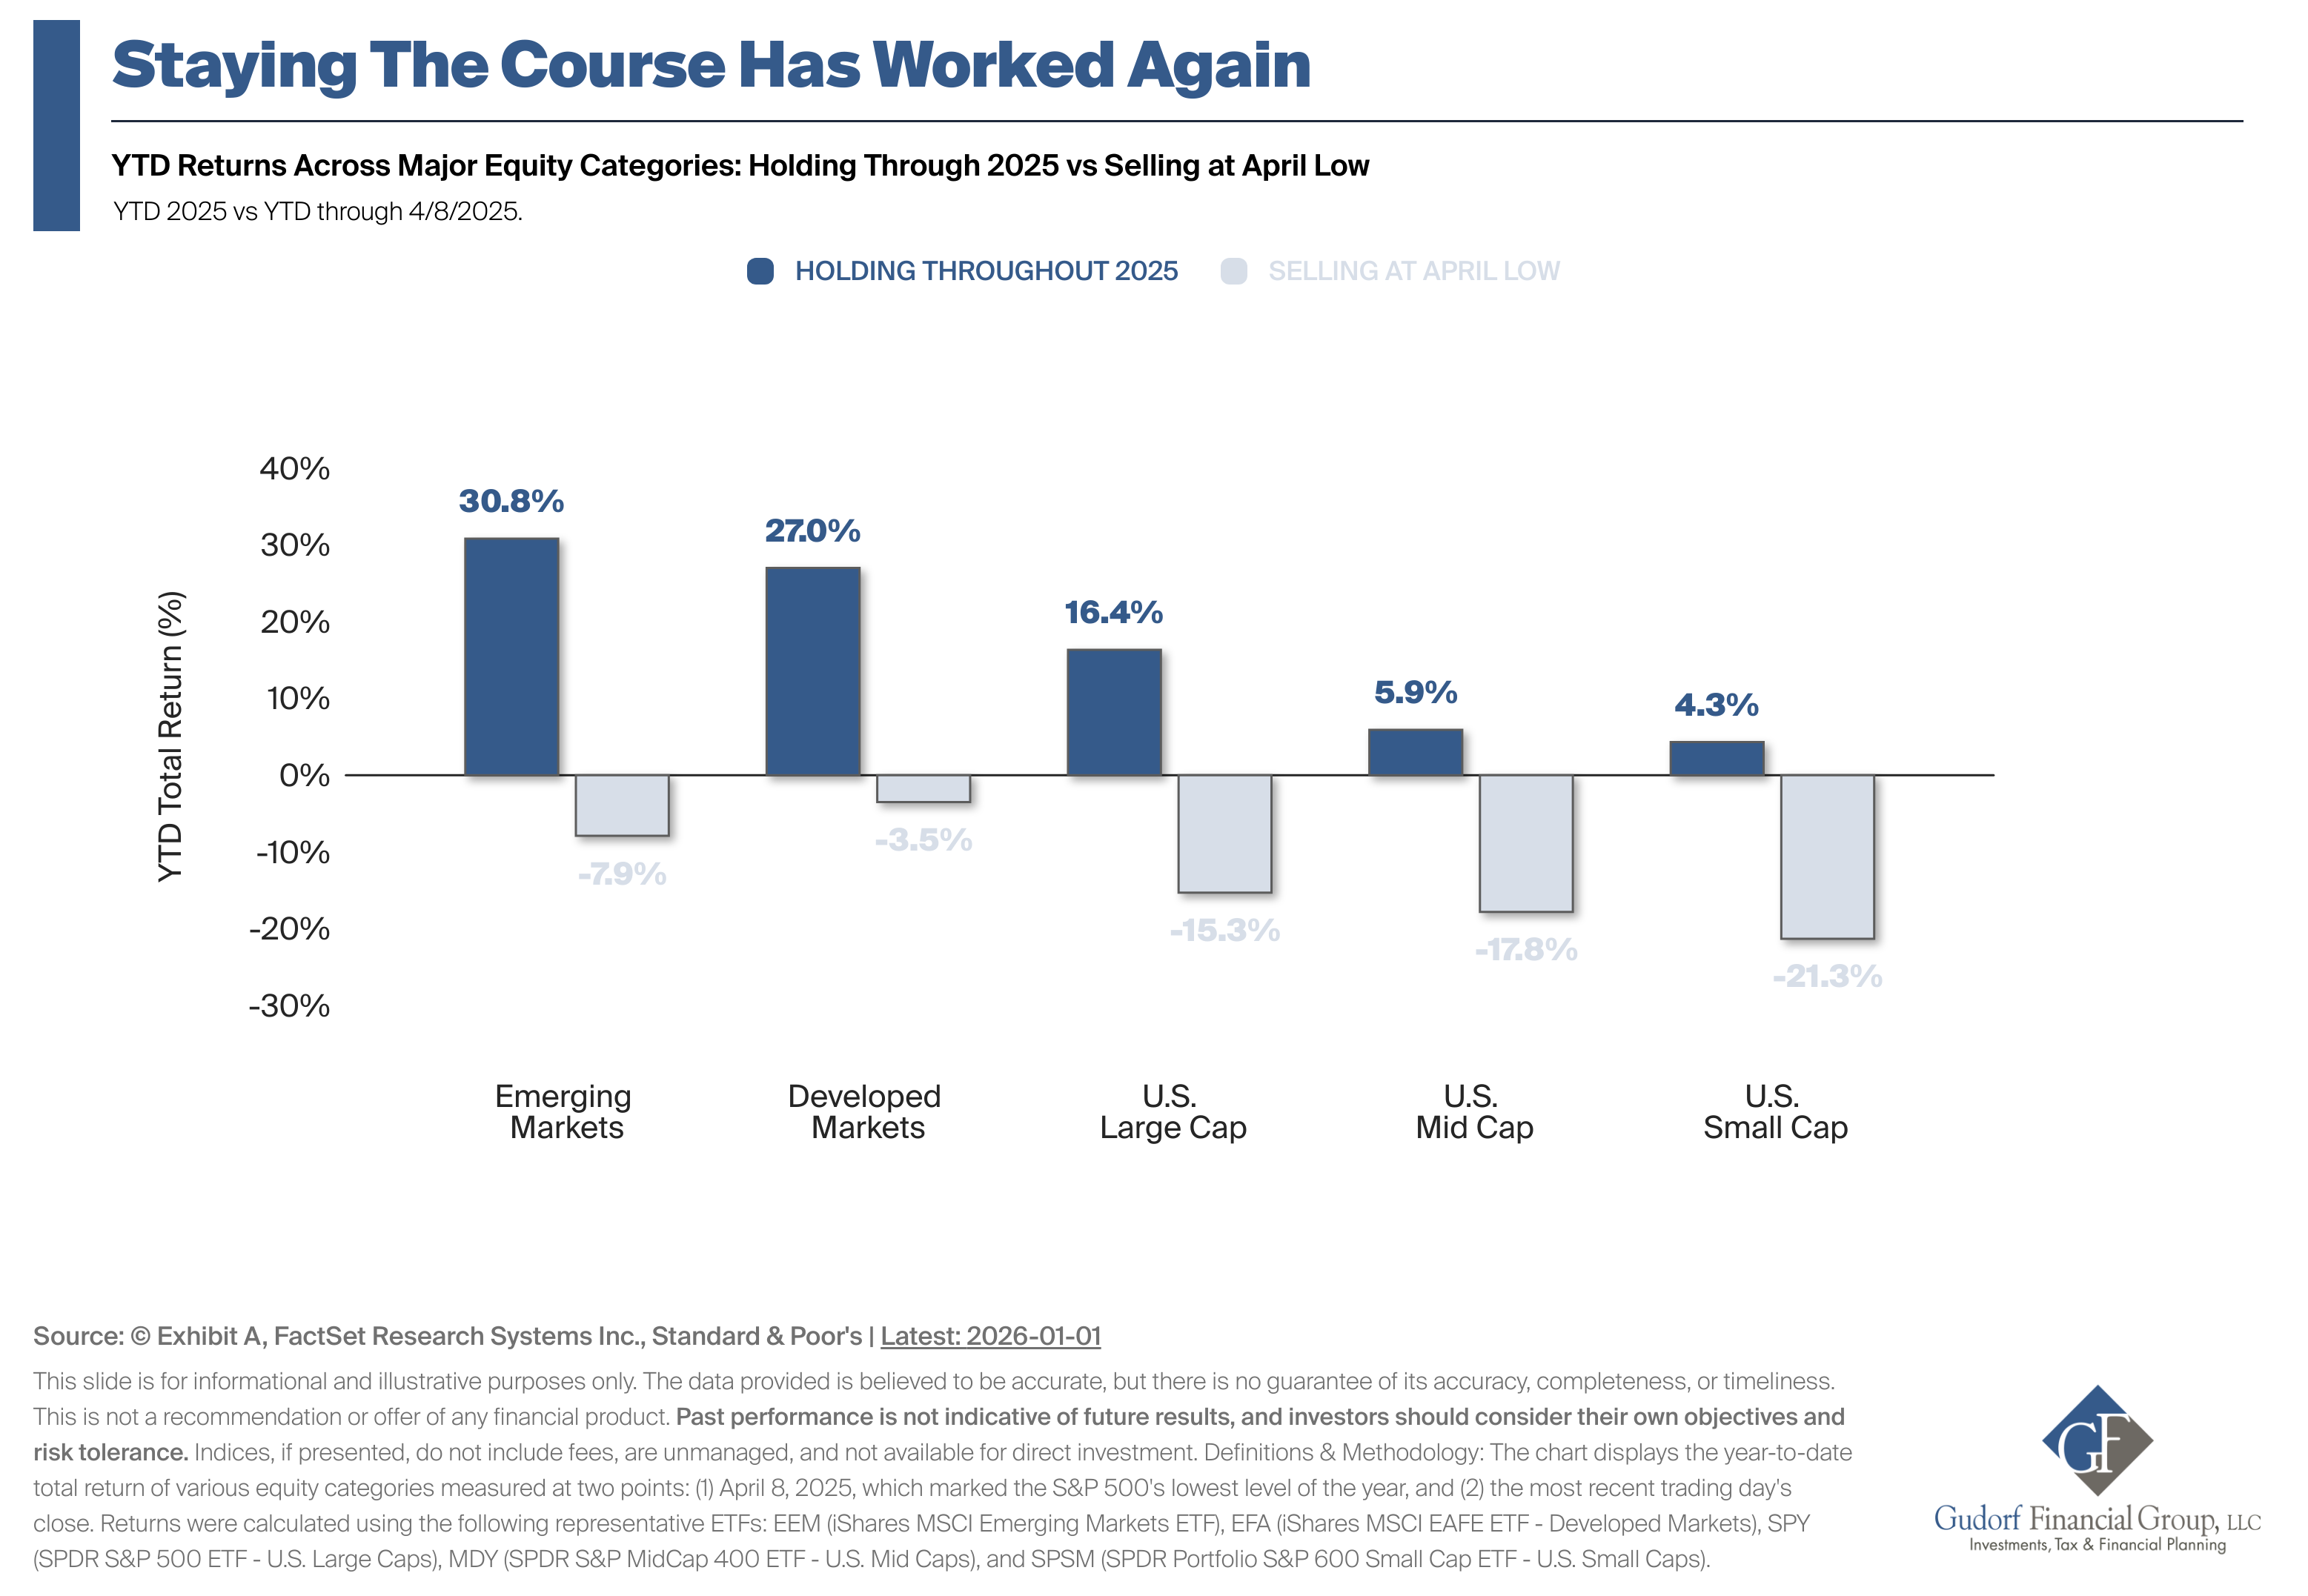
For those who stayed the course:
- U.S. Large Cap stocks: +16.4% for the full year
- U.S. Mid Cap stocks: +5.9% for the year
- U.S. Small Cap stocks: +4.3% for the year
- Developed International Markets: +27.0% for the year
- Emerging Markets: +30.8% for the year
For those who sold at the April low:
- U.S. Large Cap stocks: -7.9% (locked in losses)
- U.S. Mid Cap stocks: -15.3% (locked in losses)
- U.S. Small Cap stocks: -21.3% (locked in losses)
- Developed International Markets: -3.5% (locked in losses)
- Emerging Markets: -17.8% (locked in losses)
Look at U.S. Small Cap stocks—the difference between staying invested and selling was a staggering 25.6 percentage points. On a $500,000 portfolio heavily weighted in small caps, that's the difference between gaining $21,500 and losing $106,500. That's $128,000 in lost wealth from one emotional decision.
Why Retirees Are Especially Vulnerable
Here's something I've noticed after working with retirees for years: the closer you are to needing your money, the scarier market drops feel. When you're 67 and retired, a 19% decline doesn't feel like a temporary setback—it feels like your future disappearing.
But this emotional response, while completely understandable, often leads to the exact wrong action. When you sell during a market downturn, you accomplish two harmful things:
- You lock in your losses permanently
- You miss the recovery that historically follows
I had a client call me in April 2025, voice shaking, saying she wanted to sell everything. She was 70 years old with a well-diversified portfolio designed to last another 25+ years. We talked through her actual cash needs for the next five years—turns out she had plenty in stable investments and didn't need to touch her stock holdings at all.
She stayed invested. By December, her portfolio had not only recovered but was showing a healthy gain for the year. If she had sold, she would have locked in losses on money she didn't even need to spend for years.
Politics and Your Portfolio: The Non-Relationship
Election years always bring heightened anxiety about investments. 2024 was no exception, with a presidential election creating uncertainty heading into 2025. Many retirees asked me: "Should I adjust my portfolio based on who won?"
Chart 3: Seven Decades of Data Say "No"
The third chart that defined 2025 was actually a long-term perspective showing something remarkable: since 1950, the S&P 500 has grown from under 20 to over 6,846—regardless of which party controlled the White House.
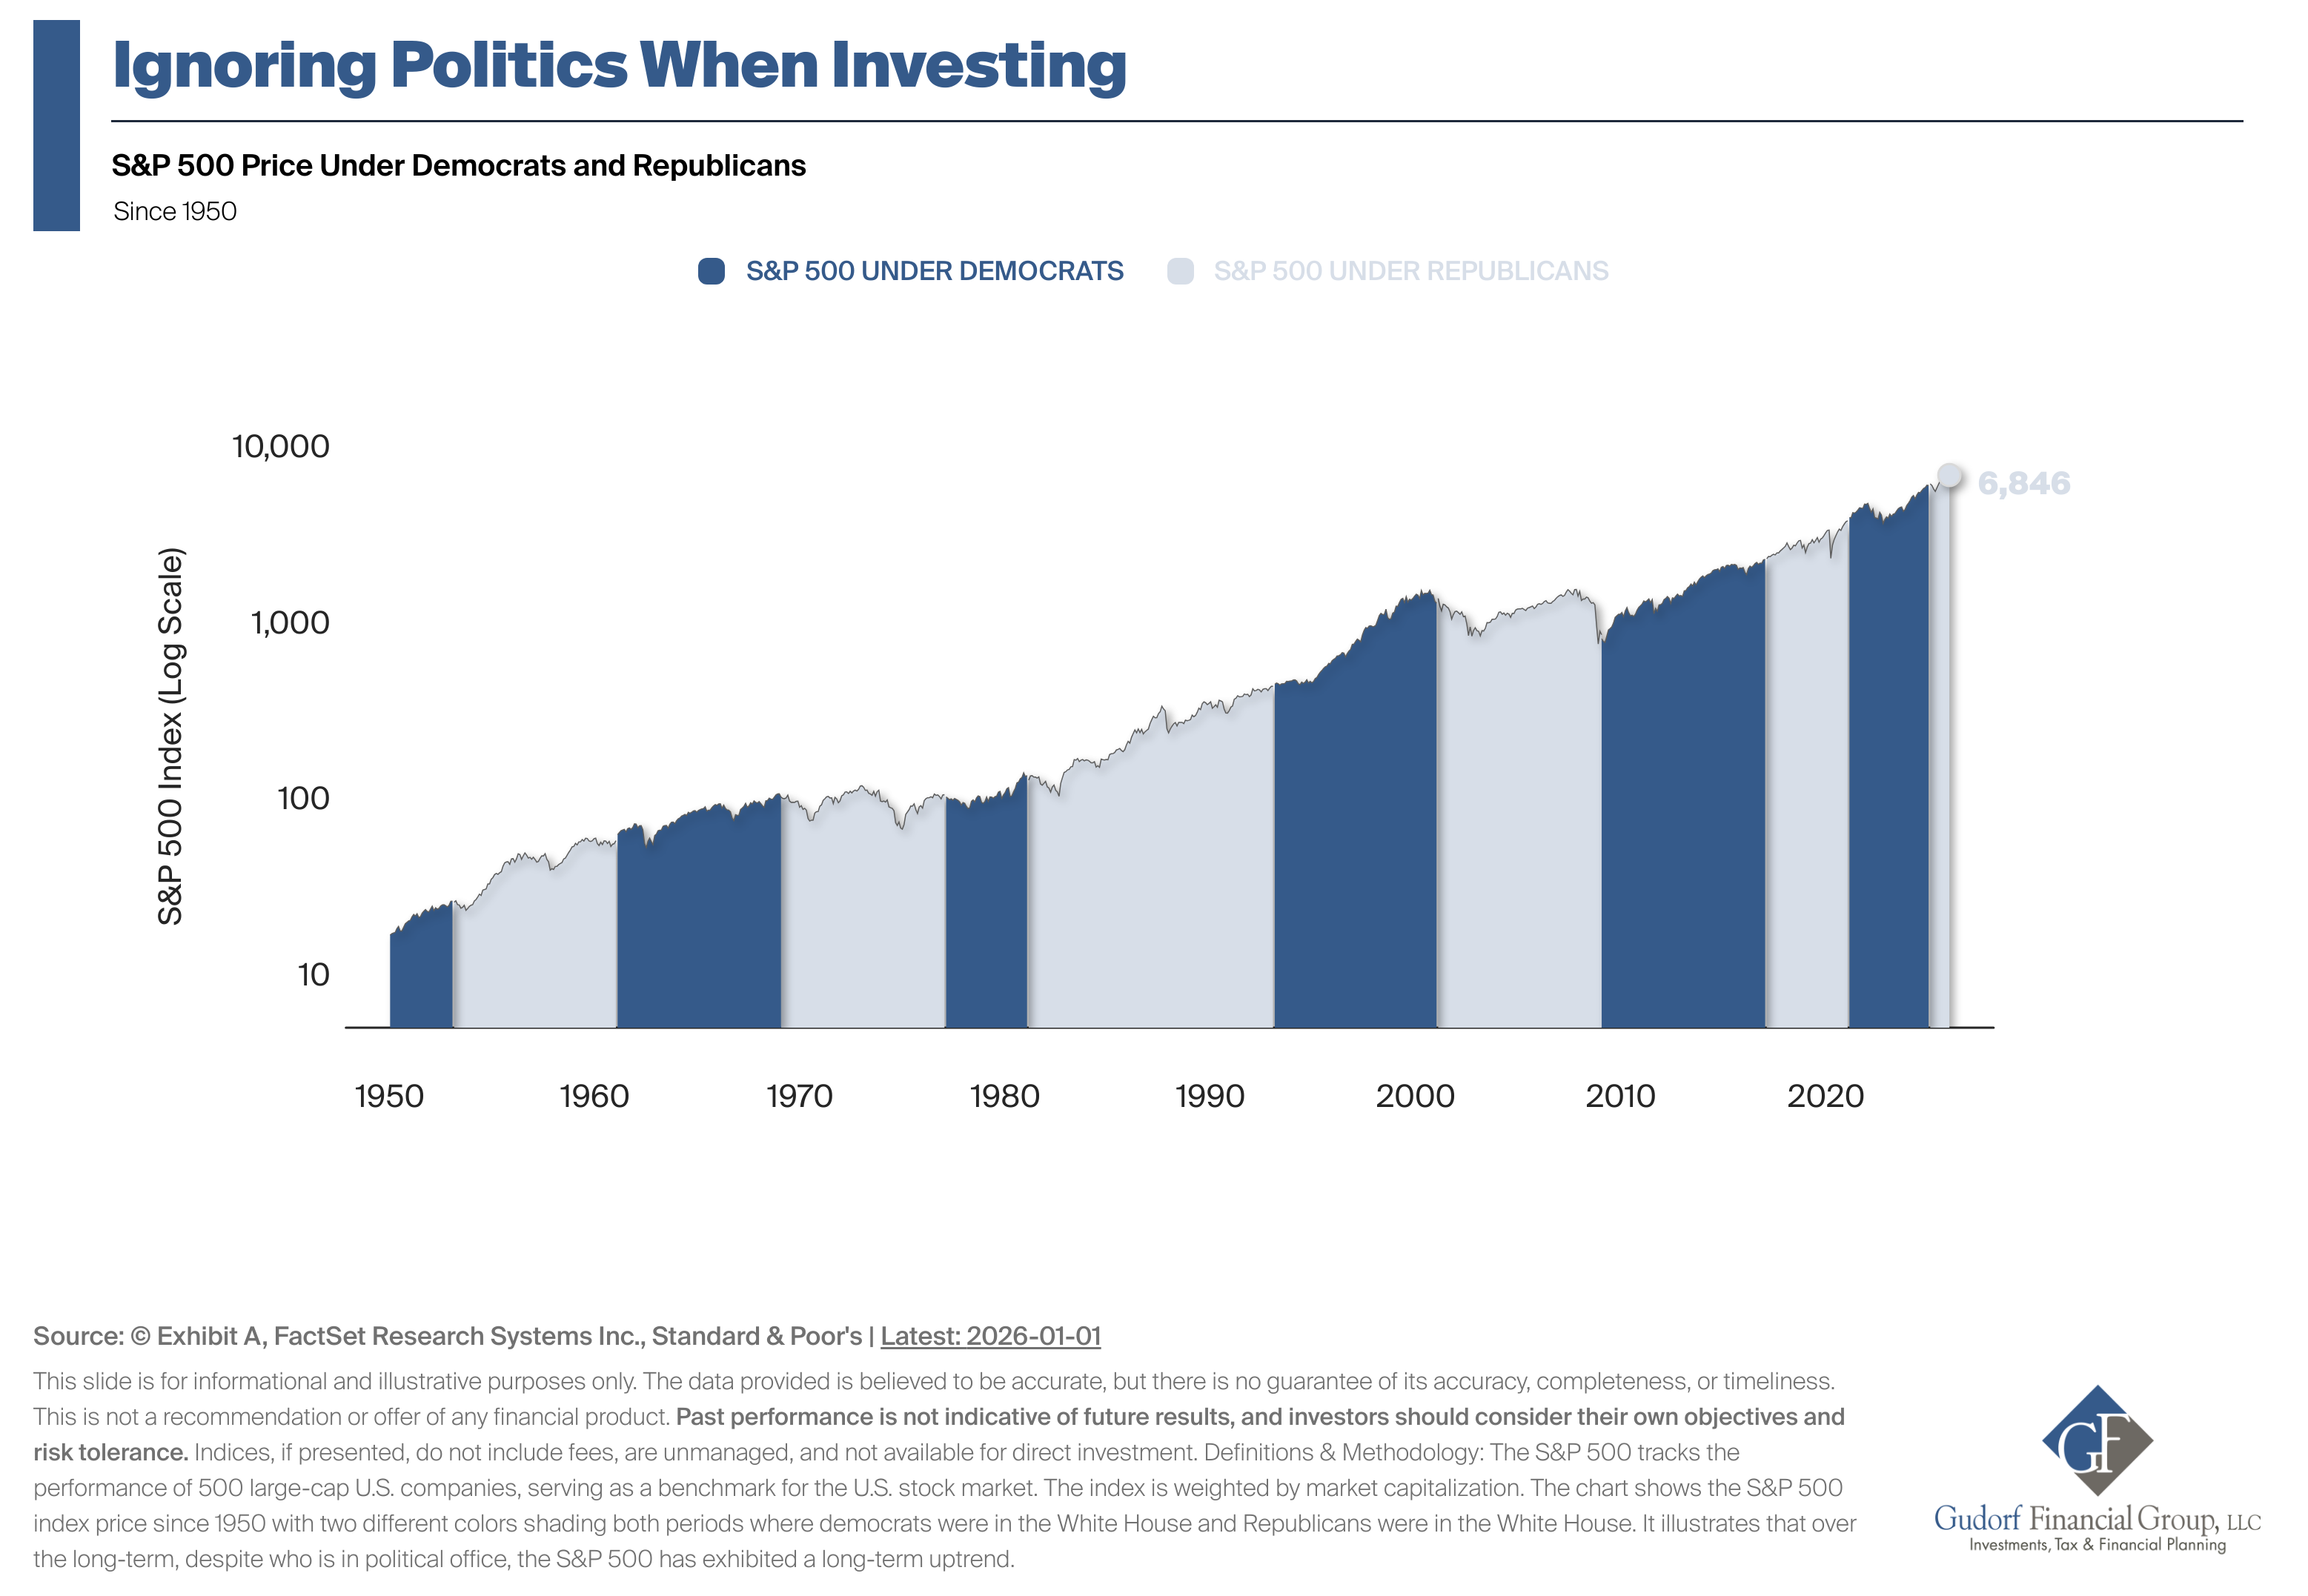
Look at the visual: there are red sections (Republican presidents) and blue sections (Democratic presidents) going back 75 years. And you know what pattern emerges? The market goes up under both parties.
Some of the strongest bull markets happened under Democratic presidents. Some happened under Republican presidents. And yes, some of the worst crashes happened under both parties too. The point is this: market performance is driven by corporate earnings, interest rates, innovation, and global economic conditions—not by who sits in the Oval Office.
Why retirees need to hear this:
Many people in retirement grew up with strong political beliefs, and that's fine. But letting those beliefs drive your investment decisions is a recipe for missed opportunities. I've seen retirees sit in cash for years because "the wrong person is president," watching their purchasing power erode to inflation while the market climbed higher.
Your retirement security shouldn't depend on election outcomes. It should depend on having a sound strategy that works regardless of political winds.
A Personal Story
I remember my grandfather refusing to invest in stocks during the Carter administration in the late 1970s. He was convinced the country was going in the wrong direction economically. He wasn't entirely wrong about the challenges of that era—inflation was terrible, interest rates were sky-high.
But by staying out of the market from 1977 to 1980, he missed the setup for one of the greatest bull markets in history that began in 1982. When he finally got back in during the Reagan years, he had missed years of compound growth he could never get back.
The lesson stuck with me: time in the market beats timing the market, and political predictions are a poor basis for investment decisions.
The Concentration Question: Should the Magnificent 7 Worry You?
Here's a concern I heard repeatedly from retirees in 2025: "Isn't it dangerous that so much of the market is just seven companies?"
Chart 4: Understanding Market Concentration
The "Magnificent 7"—Apple, Microsoft, Alphabet (Google), Amazon, Meta (Facebook), Nvidia, and Tesla—reached 36% of the total S&P 500's market value by January 2026. That means just seven companies out of 500 represent more than one-third of the index.
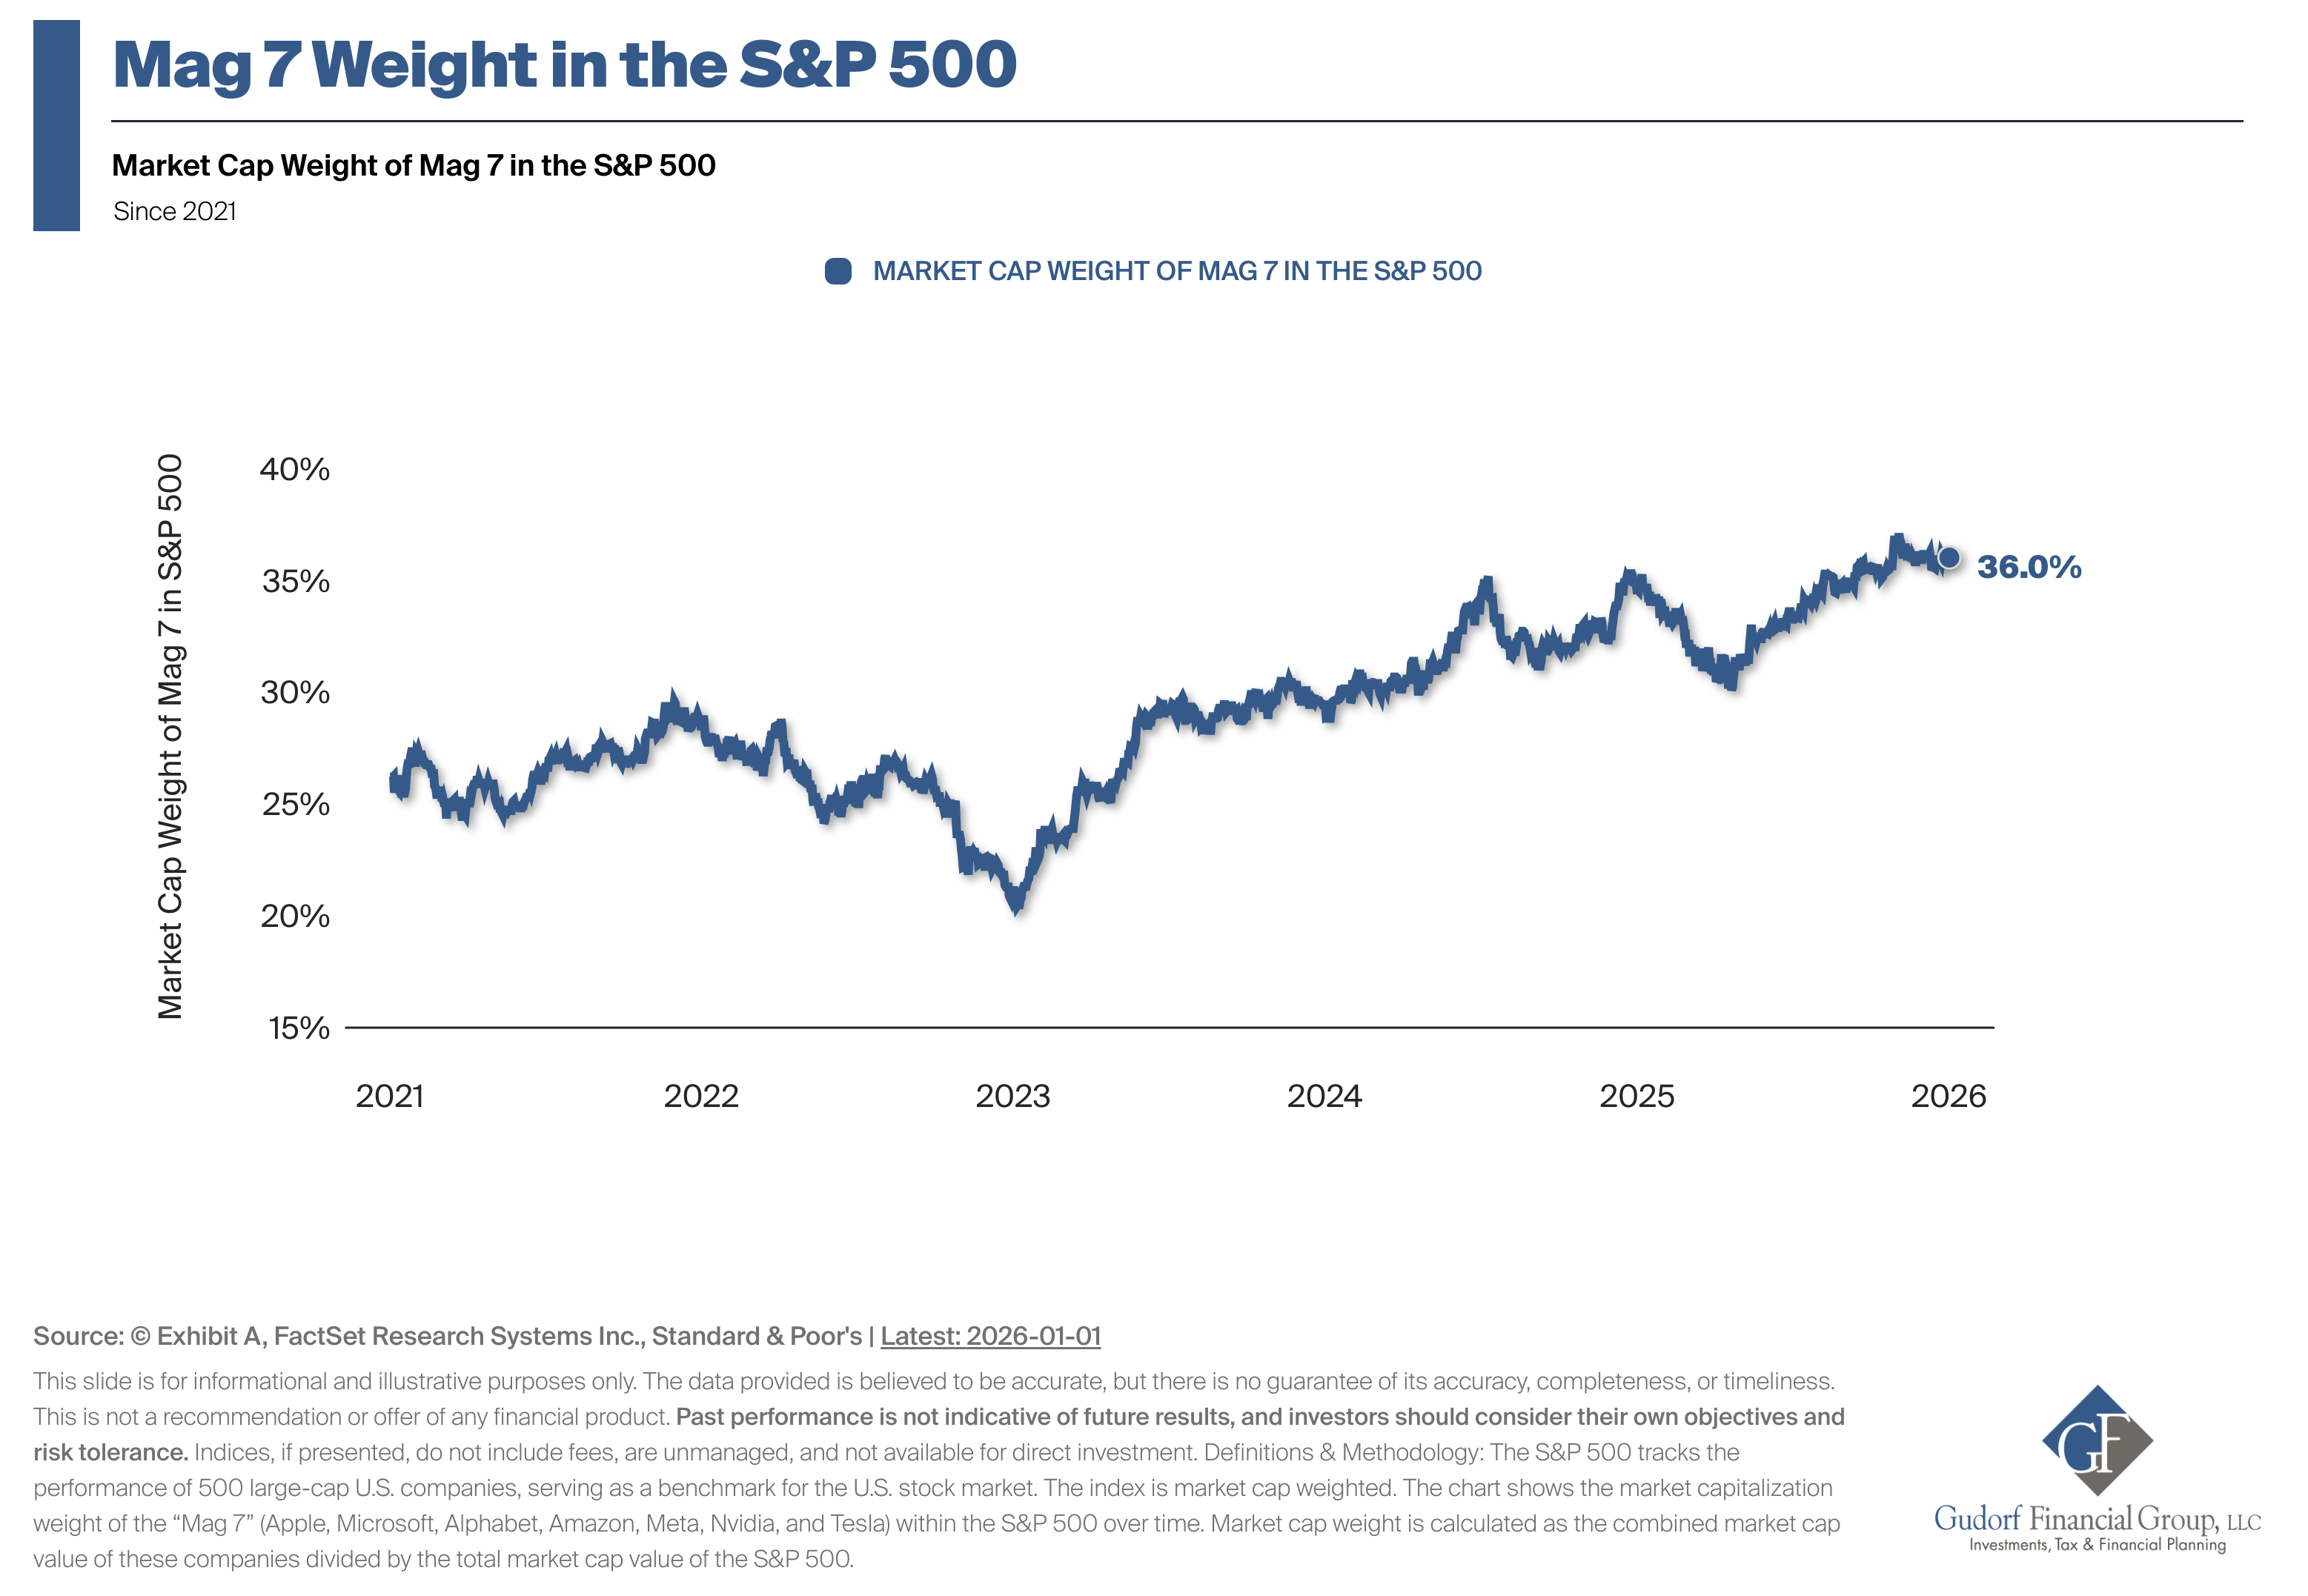
This concentration has been growing steadily since 2021, and it does raise legitimate questions about diversification. After all, one of the core principles of retirement portfolio management is not putting too many eggs in one basket.
But here's the nuance that matters:
These seven companies aren't just random stocks that got lucky. They represent dominant players in technology, digital advertising, e-commerce, and artificial intelligence—sectors that are fundamentally reshaping how the global economy operates. They have:
- Massive cash reserves
- Global operations
- Strong competitive advantages
- Consistent profitability
Does this mean they're invincible? Absolutely not. History is littered with dominant companies that eventually fell (remember when everyone thought Sears and IBM would rule forever?). But there's a difference between acknowledging concentration risk and panic-selling quality companies.
What This Means for Your Retirement Portfolio
For retirees, the Magnificent 7 concentration suggests a few practical steps:
- Make sure you own more than just the S&P 500. Include mid-cap stocks, small-cap stocks, and international investments to reduce concentration risk.
- Don't try to time when these companies will fall. Many investors have been predicting the demise of "Big Tech" for years while these companies kept growing.
- Consider factor-based or equal-weight strategies as a complement to market-cap weighted indexes, which automatically reduce concentration.
- Remember that concentration cuts both ways. Yes, it creates risk if these companies stumble, but it also means that when they perform well (as they did through much of the 2020s), index investors benefit significantly.
The key is awareness without overreaction. Know that concentration exists, diversify appropriately, but don't abandon a sound strategy because you're worried about what might happen.
Following the Money: Corporate Earnings Tell the Real Story
If market volatility, behavioral mistakes, and political noise are distractions, what should retirees actually pay attention to? The answer is simple: corporate earnings.
Chart 5: Earnings Growth Remains Strong
The fifth chart that defined 2025 showed actual earnings per share across different market segments, and the story was encouraging:
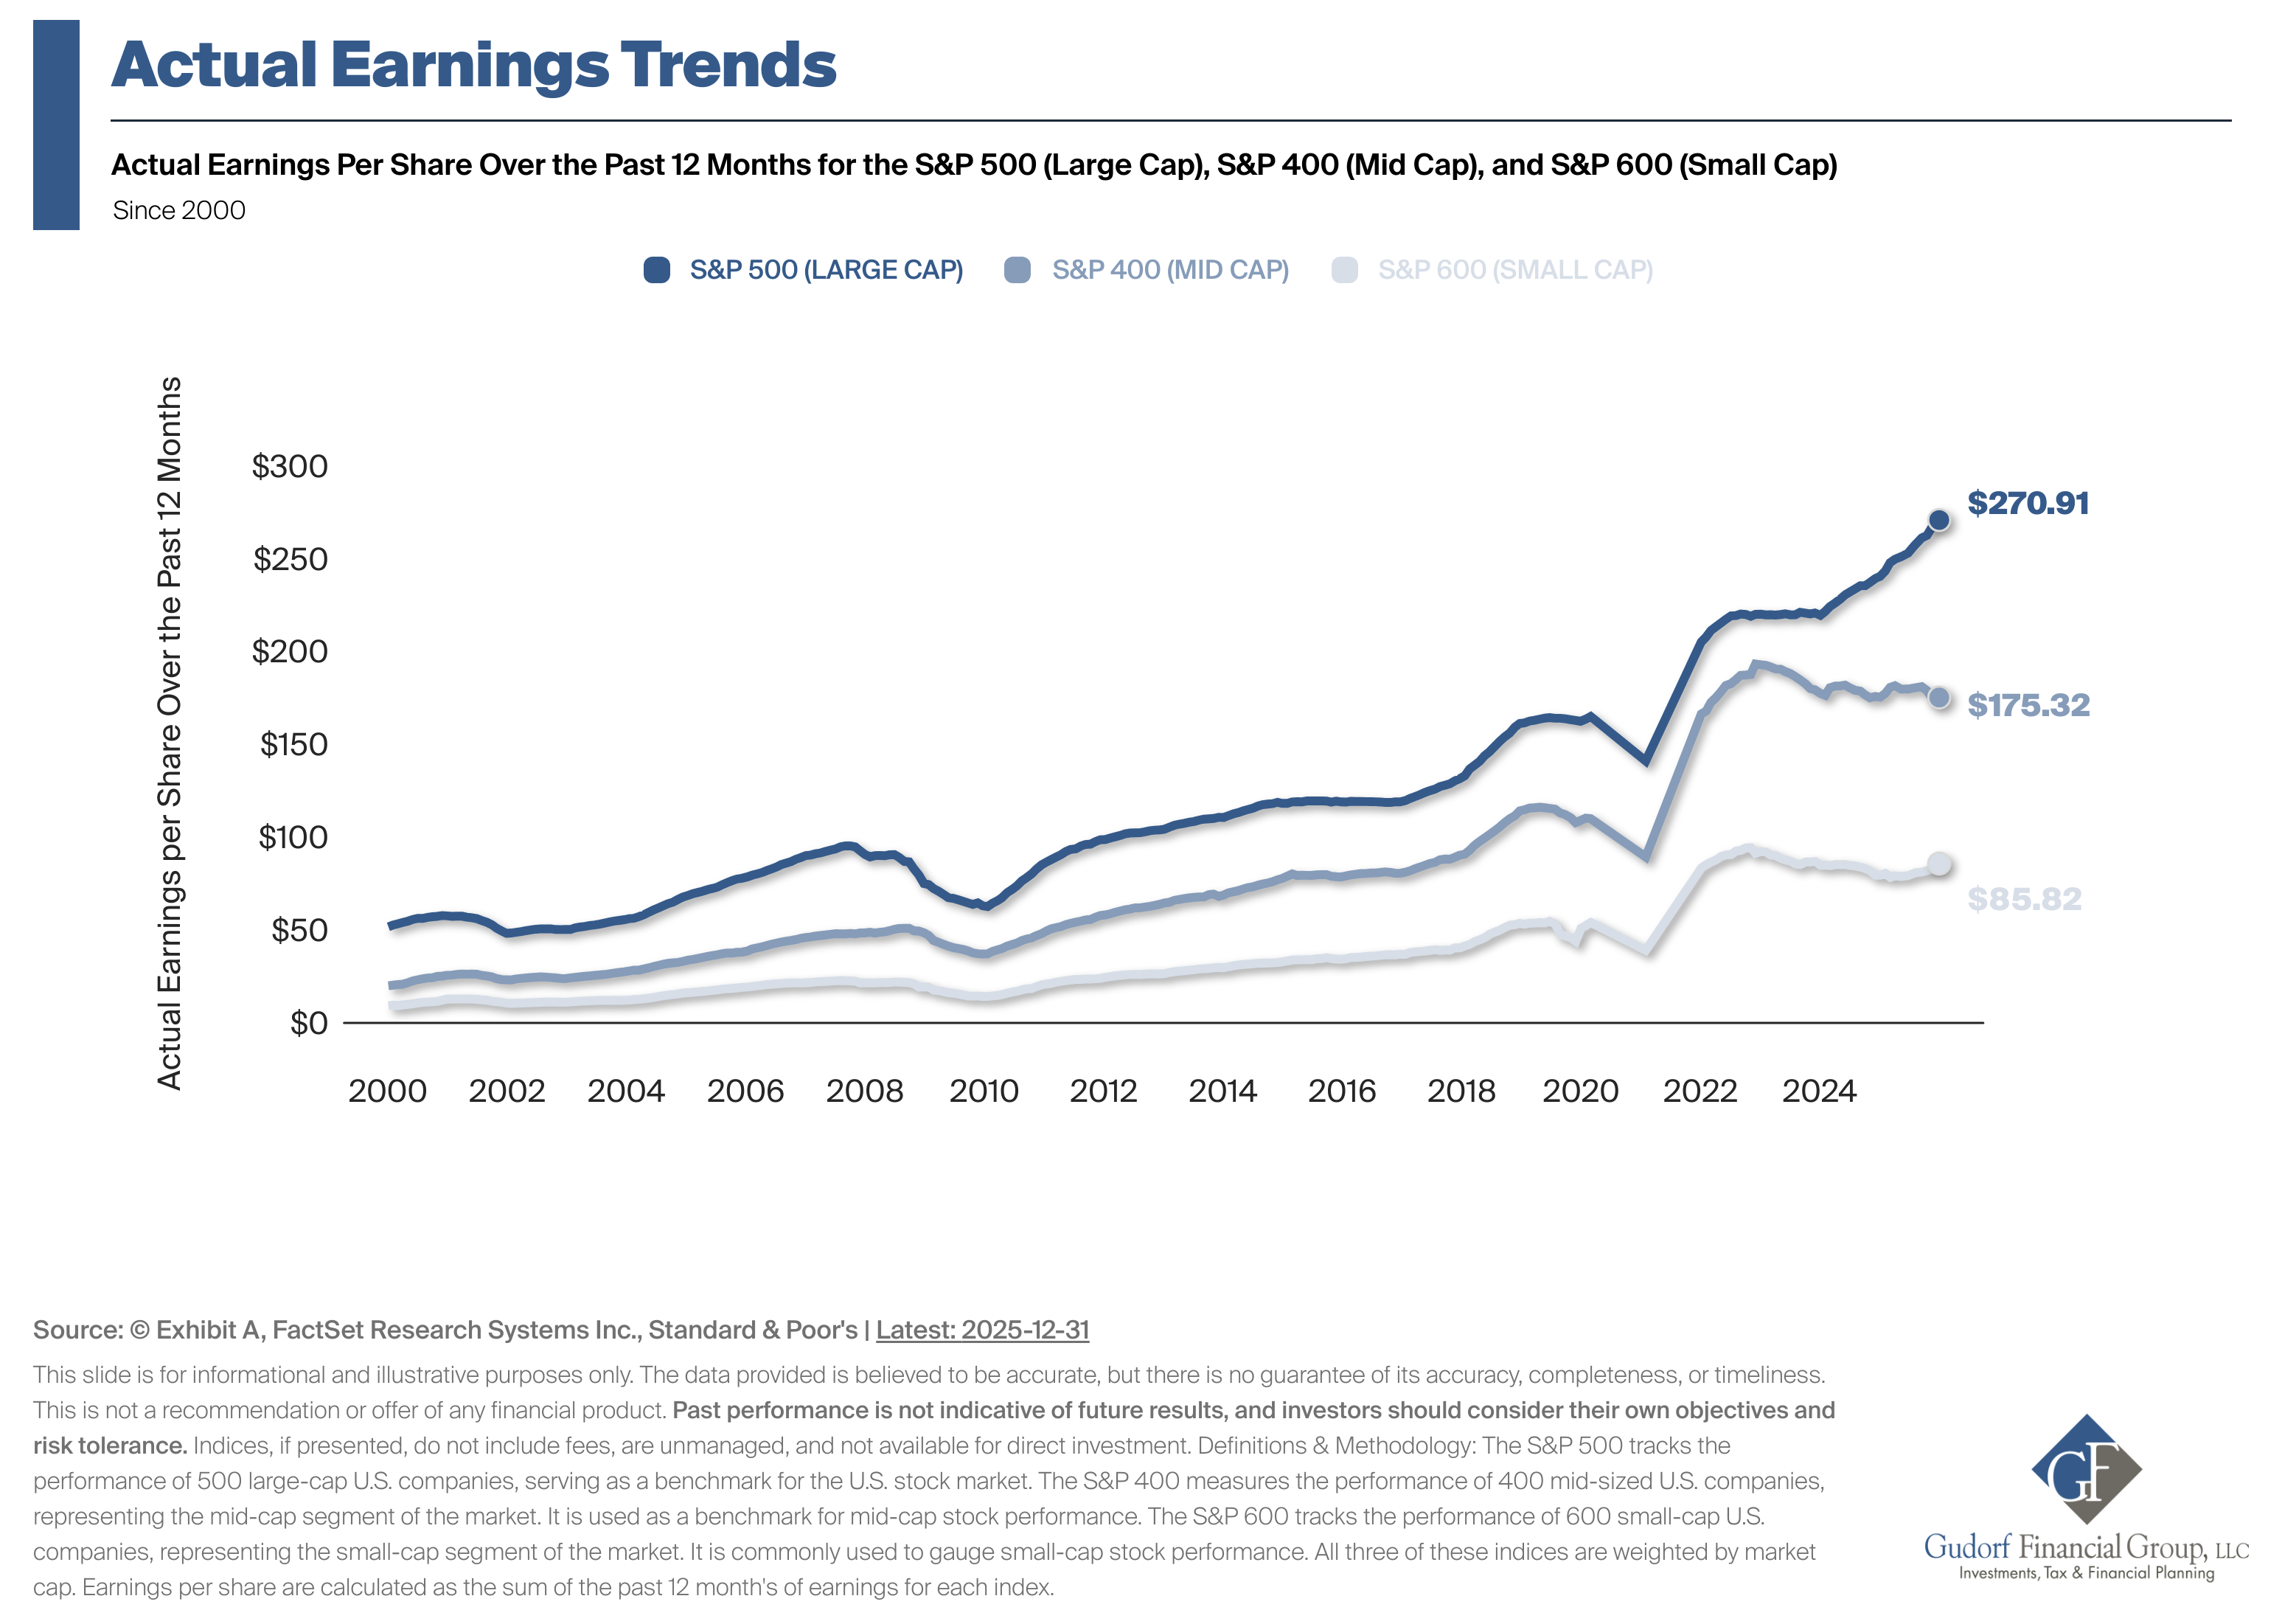
These numbers represent actual profits that companies generated over the 12 months ending December 31, 2025. And when you zoom out and look at the trend since 2000, you see something remarkable: despite two major recessions (2008-2009 and 2020), corporate earnings have grown substantially over time.
Why does this matter for retirees?
Stock prices follow earnings over the long term. Sure, prices can get disconnected from earnings for months or even a couple years—that's what creates volatility and the opportunities we saw in April 2025. But eventually, prices reflect the underlying profitability of companies.
When you see strong earnings growth like we saw in 2025, it tells you that companies are actually making money. This isn't speculation or hype—it's real profits from selling real products and services to real customers. That's the foundation of sustainable stock market returns.
The Inflation Connection
For retirees especially, there's another crucial aspect to earnings growth: it's one of the best hedges against inflation. When companies can raise prices and maintain profitability, the value of your stock holdings keeps pace with (or exceeds) inflation.
Compare this to keeping too much money in cash or low-yielding bonds. While those feel "safe," they're almost guaranteed to lose purchasing power over a 20- or 30-year retirement when inflation averages 3% per year.
Companies that consistently grow earnings—the kind that make up large portions of broad market indexes—have pricing power. They can pass costs along to customers. That means your ownership stake (stock shares) maintains its real value over time.
Practical Applications: What Should Retirees Do Now?
Okay, we've covered a lot of data and concepts. But what does all this mean for your day-to-day decisions about your retirement portfolio? Let me break it down into actionable steps.
Create a Volatility Plan Before You Need One
The biggest mistake retirees make isn't having the wrong investments—it's having no plan for how they'll respond to volatility. When the market drops 15% or 20%, what will you do?
Your volatility plan should include:
- A cash reserve strategy: Keep 1-3 years of living expenses in cash or short-term bonds. This way, you're never forced to sell stocks at the worst time.
- A rebalancing trigger: Decide in advance when market movements are large enough to warrant adjustments. For example, if stocks drop enough that they're now 5% below your target allocation, buy more to get back to your target.
- An information diet: Limit how often you check your accounts during volatile periods. Daily checking leads to daily emotional responses. Monthly or quarterly reviews are sufficient.
- A trusted advisor relationship: Having someone to talk through your concerns before making rash decisions is invaluable. Even if you're a do-it-yourself investor, consider a consultation relationship with a financial planner for moments of high stress.
Diversify Beyond the Headlines
The Magnificent 7 concentration we discussed suggests broadening your holdings. Here's how:
Domestic diversification:
- Core S&P 500 holding (provides exposure to large caps including the Mag 7)
- Mid-cap fund (provides exposure to growing companies not yet mega-caps)
- Small-cap fund (provides exposure to smaller, potentially faster-growing businesses)
International diversification:
- Developed international markets (Europe, Japan, Australia, etc.)
- Emerging markets (China, India, Brazil, etc.)
Sector awareness:
- Consider if you're overweight technology through multiple holdings
- Balance with exposure to healthcare, consumer staples, utilities, and financials
You don't need dozens of holdings to be diversified, but you do need to look beyond just owning an S&P 500 fund, especially given current concentration levels.
Ignore Political Predictions
Seriously. Just stop trying to predict how politics will affect markets. History shows it's a fool's errand. Stay invested through Republican and Democratic administrations alike.
If you find yourself thinking, "But this time is different because..." stop right there. Every political era feels uniquely uncertain when you're living through it. None of it matters as much as you think for long-term investment returns.
Focus on What You Can Control
You can't control market returns, political outcomes, or whether the Magnificent 7 remain dominant. But you can control:
- Your savings and spending rates: The more efficiently you spend in retirement, the less dependent you are on market returns.
- Your tax strategy: Which accounts you withdraw from and when can significantly impact your after-tax returns. Roth conversions, qualified charitable distributions, and tax-loss harvesting all matter.
- Your investment costs: Every dollar paid in unnecessary fees is a dollar that can't compound for you. Keep costs low through index funds and reasonable advisory fees.
- Your behavior: This is the biggest factor. The difference between holders and sellers in April 2025 wasn't luck—it was behavior.
The Bigger Picture: Retirement Is a Long Game
Here's something that gets lost in all the year-to-year market analysis: retirement isn't a moment, it's a multi-decade journey. If you retire at 65, you could easily live another 25-30 years. That's longer than many people's working careers.
This means you need growth in your portfolio, not just preservation. A retirement portfolio that's too conservative—trying to avoid all volatility—actually creates a different risk: running out of money because your assets didn't keep pace with inflation and your spending needs.
The Math of Longevity
Let's run some numbers:
Suppose you retire at 65 with $1 million saved. You plan to withdraw $40,000 per year (4% initial withdrawal rate), adjusting for inflation each year. Your portfolio is invested 60% in stocks and 40% in bonds.
Scenario 1: You panic sell during the next bear market (like April 2025) and move to 30% stocks, 70% bonds.
With lower expected returns from the more conservative allocation, there's a much higher probability your money runs out before age 90. The additional "safety" you felt actually created more risk.
Scenario 2: You maintain your 60/40 allocation through market volatility, rebalancing when needed.
Historical data suggests a much higher probability your money lasts through age 95 and beyond, even accounting for several market downturns along the way.
The irony is that trying to avoid short-term volatility often creates long-term failure. Embracing some volatility as the price of growth often creates long-term success.
Learning From 2025: Questions to Ask Yourself
As we look back at what 2025 taught us, here are some questions worth asking about your own situation:
About volatility:
- How did I feel when markets dropped in April 2025?
- Did I check my accounts more frequently during the downturn?
- Did I consider making changes that I didn't ultimately make?
- What would help me feel more confident during the next downturn?
About staying invested:
- Do I have enough in stable investments to cover my needs for the next 2-3 years?
- Am I clear about which money is for short-term needs versus long-term growth?
- Do I have a written plan for how I'll respond to a 20% market decline?
About political influence:
- Have I ever made an investment decision based primarily on political beliefs?
- Do I find myself checking financial news more during election years?
- Am I able to separate my political views from my investment strategy?
About concentration and diversification:
- Do I know what I actually own in my portfolio?
- Am I diversified beyond large U.S. companies?
- Have I reviewed whether my current mix still makes sense for my age and needs?
About earnings and fundamentals:
- Do I understand what drives stock returns over the long term?
- Am I focused on what matters (earnings, valuations) or what doesn't (daily news, predictions)?
The Bottom Line: What 2025 Really Taught Us
These aren't rhetorical questions. Take time to actually think through your answers. Better yet, write them down. Self-awareness about your behavioral tendencies is half the battle in successful retirement investing.
The story of 2025 is ultimately a story about perspective. In the moment, April's decline felt catastrophic to many. Looking back from January 2026, it was simply another example of normal market behavior—scary when you're in it, but temporary and ultimately followed by recovery.
Your retirement success won't be determined by whether you can predict the next market move or election outcome. It will be determined by whether you have a sound plan and the discipline to stick with it when fear is telling you to do something else.
That's what the five charts that defined 2025 really teach us: patience, diversification, and behavioral discipline aren't just good advice—they're the difference between retirement success and retirement stress.